


CemBR has launched a data driven report on the EU ETS and its impact on the cement sector. This report is designed specifically for the cement industry and contains unique and useful data, insights and analysis.
A data driven report on the cement market and industry of the country based on the CemBR Global Compendium (CGC™) Database and CemBR Forecasts. This report will help the reader understand this cement market by providing both significant data points and relevant insights.
Contents of Report:
– Cement process CO2 emissions (explanation)
o Sources of CO2 in cement manufacturing
o Technology of European cement pants and CO2 implications
– What impacts CO2 emissions in the cement sector?
o Raw materials impact
o Fuel combustion impact (incl. Alternatives)
o Grinding process – clinker substitution
– Carbon credits in the European Union – Background
o Introduction – Phases of ETS
o Cement plant operations prior to 2007-2008 crisis
o What happened between 2008 and today?
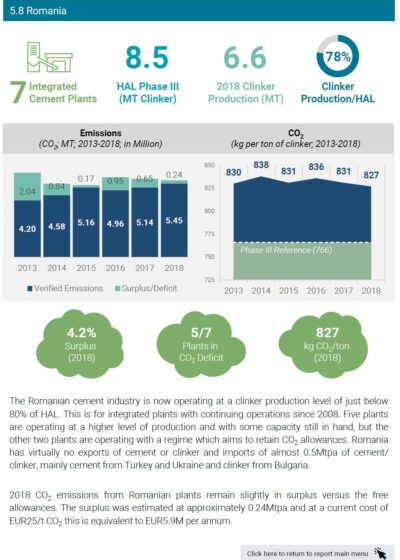
– Phase III (2013 – 2018) situation analysed country by country – Full Database
– Plant by plant 2018 clinker production versus Historical Activity Level (HAL)
– Conclusions on country by country analysis
o Production versus capacity and Exports/Imports balance
o Plant closures
o Estimated financial impact of CO2 on the sector
o European performance on CO2 reduction between 2005 and 2018
– The economics of a cement plant within the EU ETS (2019 and 2020)
– Conclusions
Some of the questions answered accurately by this report:- What are the main sources of CO2 emissions in cement manufacturing?
– What were the characteristics of the three phases of EU ETS, spanning between 2005 and 2020?
– How and when were allowances set for Phase III (current phase)?
– What has been the pricing of carbon credits and how might that have affected cement producers’ behaviour so far?
– How did the 28 countries in the scheme (28 out of 31 have integrated cement plants) performed in Phase III?
o Have they managed to lower their CO2 per tonne of clinker and by how much?
o Is the country currently in surplus or deficit of carbon credits, by how much?
o How did they manage to keep their allowances after the financial crisis?
o How have different countries behaved in terms of imports/exports?
– Which plants are below, at or above their HAL (Historical Activity Level) for clinker production in 2018?
– Which plants can increase production without exceeding their free allowances?
– What is the financial impact on plants operating under several scenarios of:
– CO2 per tonne of clinker
– Exports driven capacity utilisation
– Overall capacity utilisation
– Alternative fuels utilisation
– How are all the plants positioned for Phase IV of EU ETS?
…and many more
Our proprietary analytical tools:
Domestic Capacity Utilisation Factor – DCUF™ – Propensity to export / import.
International Trading Assessment Matrix – ITAM™, Capability to export / import.
Capacity Concentration Balance Index (CCBI™). CCBI™ assesses the potential of each cement plant’s theoretical sales to each statistically available region of a national market, taking into account the plant’s capacity and proximity to consumption centres.
Micro-Market Attractiveness Matrix (MAM™). MAM™ examines statistically available regions for their existing and potential growth prospects.
Industry Structure and Dynamics – ISD™ – Nature of Participants, Consolidation Index, Cost Structure and Industry Profitability.
CemBR Ranking Tool – CemBRRT™ – Overall Market Attractiveness Assessment
All CemBR products are sold either with an individual or corporate licence. The type and price for each licence will be displayed in the specific product page.
CemBR products are provided as: in a PDF format, a hard copy, a combination of both or as access to specific databases. Each product will display the format on the specific product page.
All products in PDF format will be sent to an individual email address.